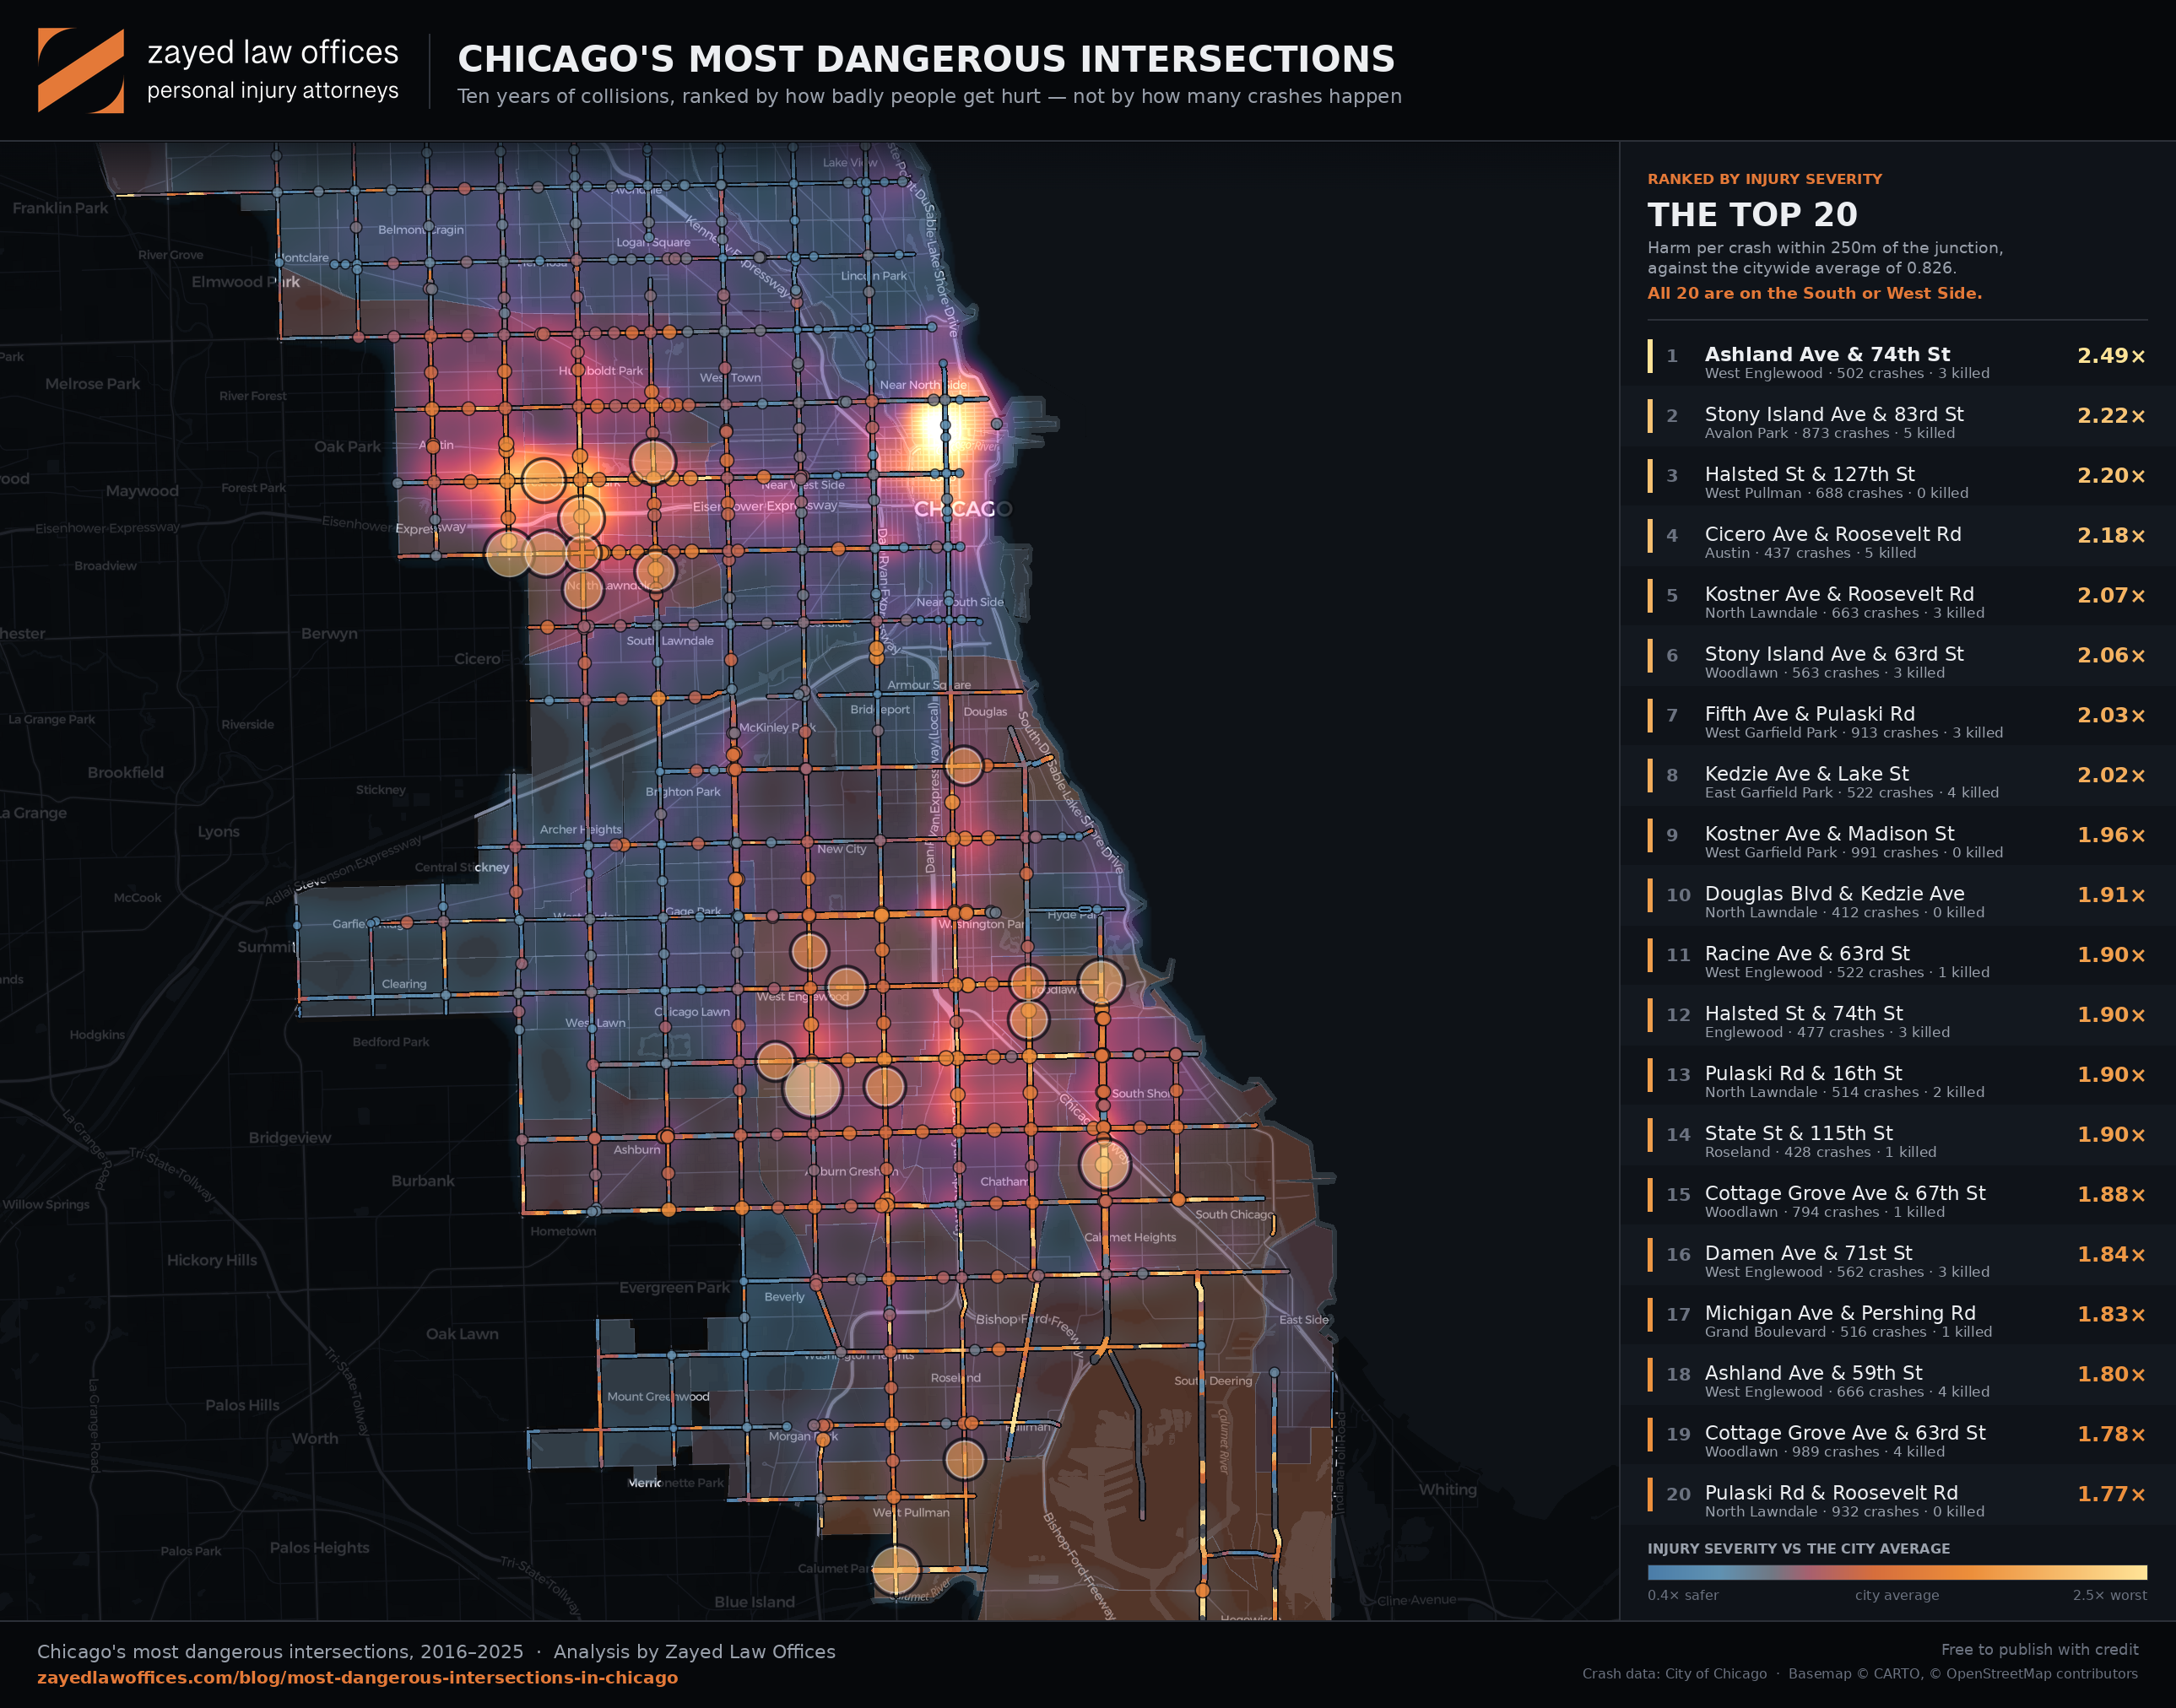

We analysed every reported collision in Chicago over the last ten years — more than a million of them — and scored each intersection not on how many crashes happen there, but on how much damage a crash there actually does. All twenty of the worst are on the South or West Side.
The short version
- Ashland Ave & 74th St in West Englewood is the most dangerous intersection in Chicago. A crash there does 2.49 times the human damage of an average Chicago crash.
- All 20 are on the South or West Side. Twelve South Side, eight West Side. None downtown, none on the North Side.
- Across those 20 corners: 12,964 crashes, 4,656 people injured, 557 of them seriously, and 46 killed in ten years.
- The busiest intersections are not the most dangerous ones. Not one of Chicago’s twenty busiest junctions appears in the severity top 20. Grand Ave & State St sees more crashes than any corner in the city — 3,531 in ten years — at 0.69× the citywide severity rate.
- Sunday is the most dangerous day; 2am the most dangerous hour. Friday produces the most crashes and the least harmful ones.
- Weekend nights are far deadlier than weekday daytime. Per crash, a Saturday or Sunday collision between 10pm and 5am is 6.8 times more likely to kill someone than a weekday daytime one.
Explore the map
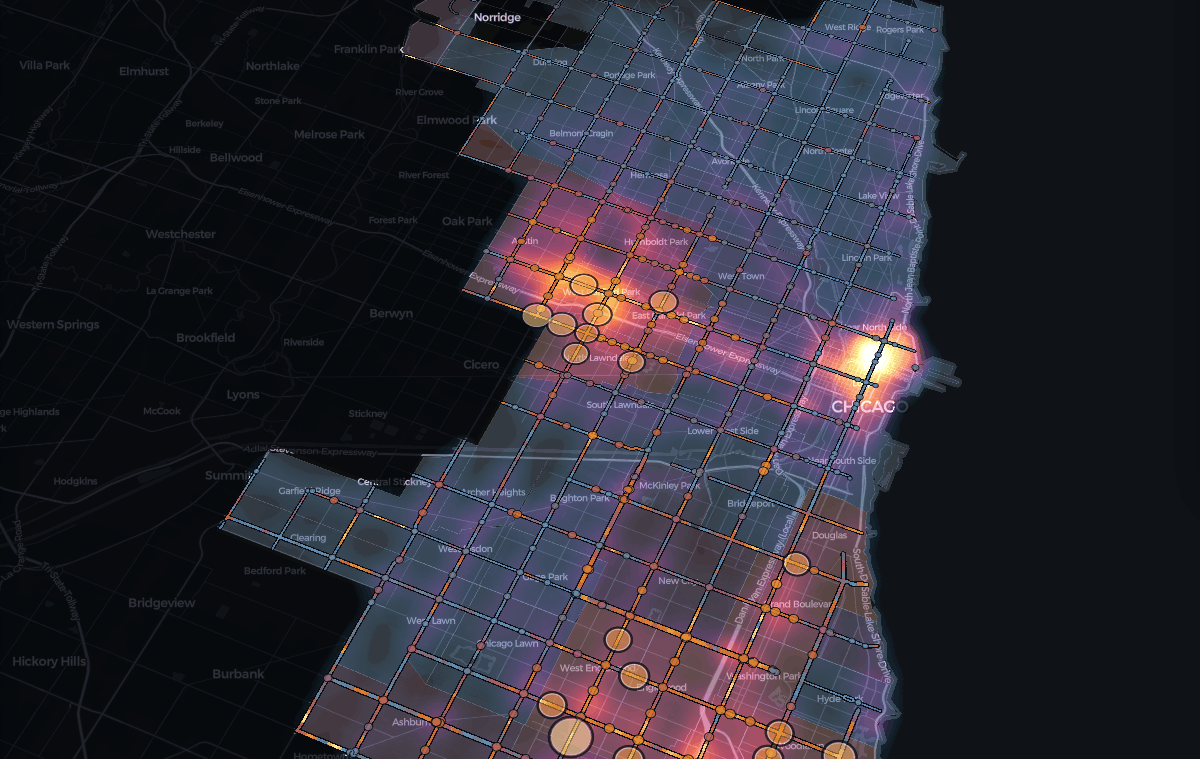
Every eligible junction in the city is on the map below. Switch between severity and crash volume to see how differently the two rank the same streets, and click any corner for its ten-year record.
The worst corner in Chicago: Ashland Ave & 74th St
Between 2016 and 2025 there were 502 reported crashes within 250 metres of Ashland Ave & 74th St in West Englewood. Those crashes injured 201 people, 32 of them seriously enough to be recorded as incapacitating, and killed 3.
That is not an unusual number of crashes. Dozens of Chicago intersections see more. What sets this corner apart is what happens when a crash occurs: the average collision here does 2.49 times the harm of the average Chicago collision. It is the highest ratio of any qualifying junction in the city.
Ashland Avenue is one of Chicago’s longest north–south arterials, running roughly 33 kilometres through the West and South Sides. Long, straight, multi-lane arterials carrying fast traffic through residential neighbourhoods are the recurring pattern across this entire list — and it is the same pattern the city itself identified when it drew up its Vision Zero High Injury Network.
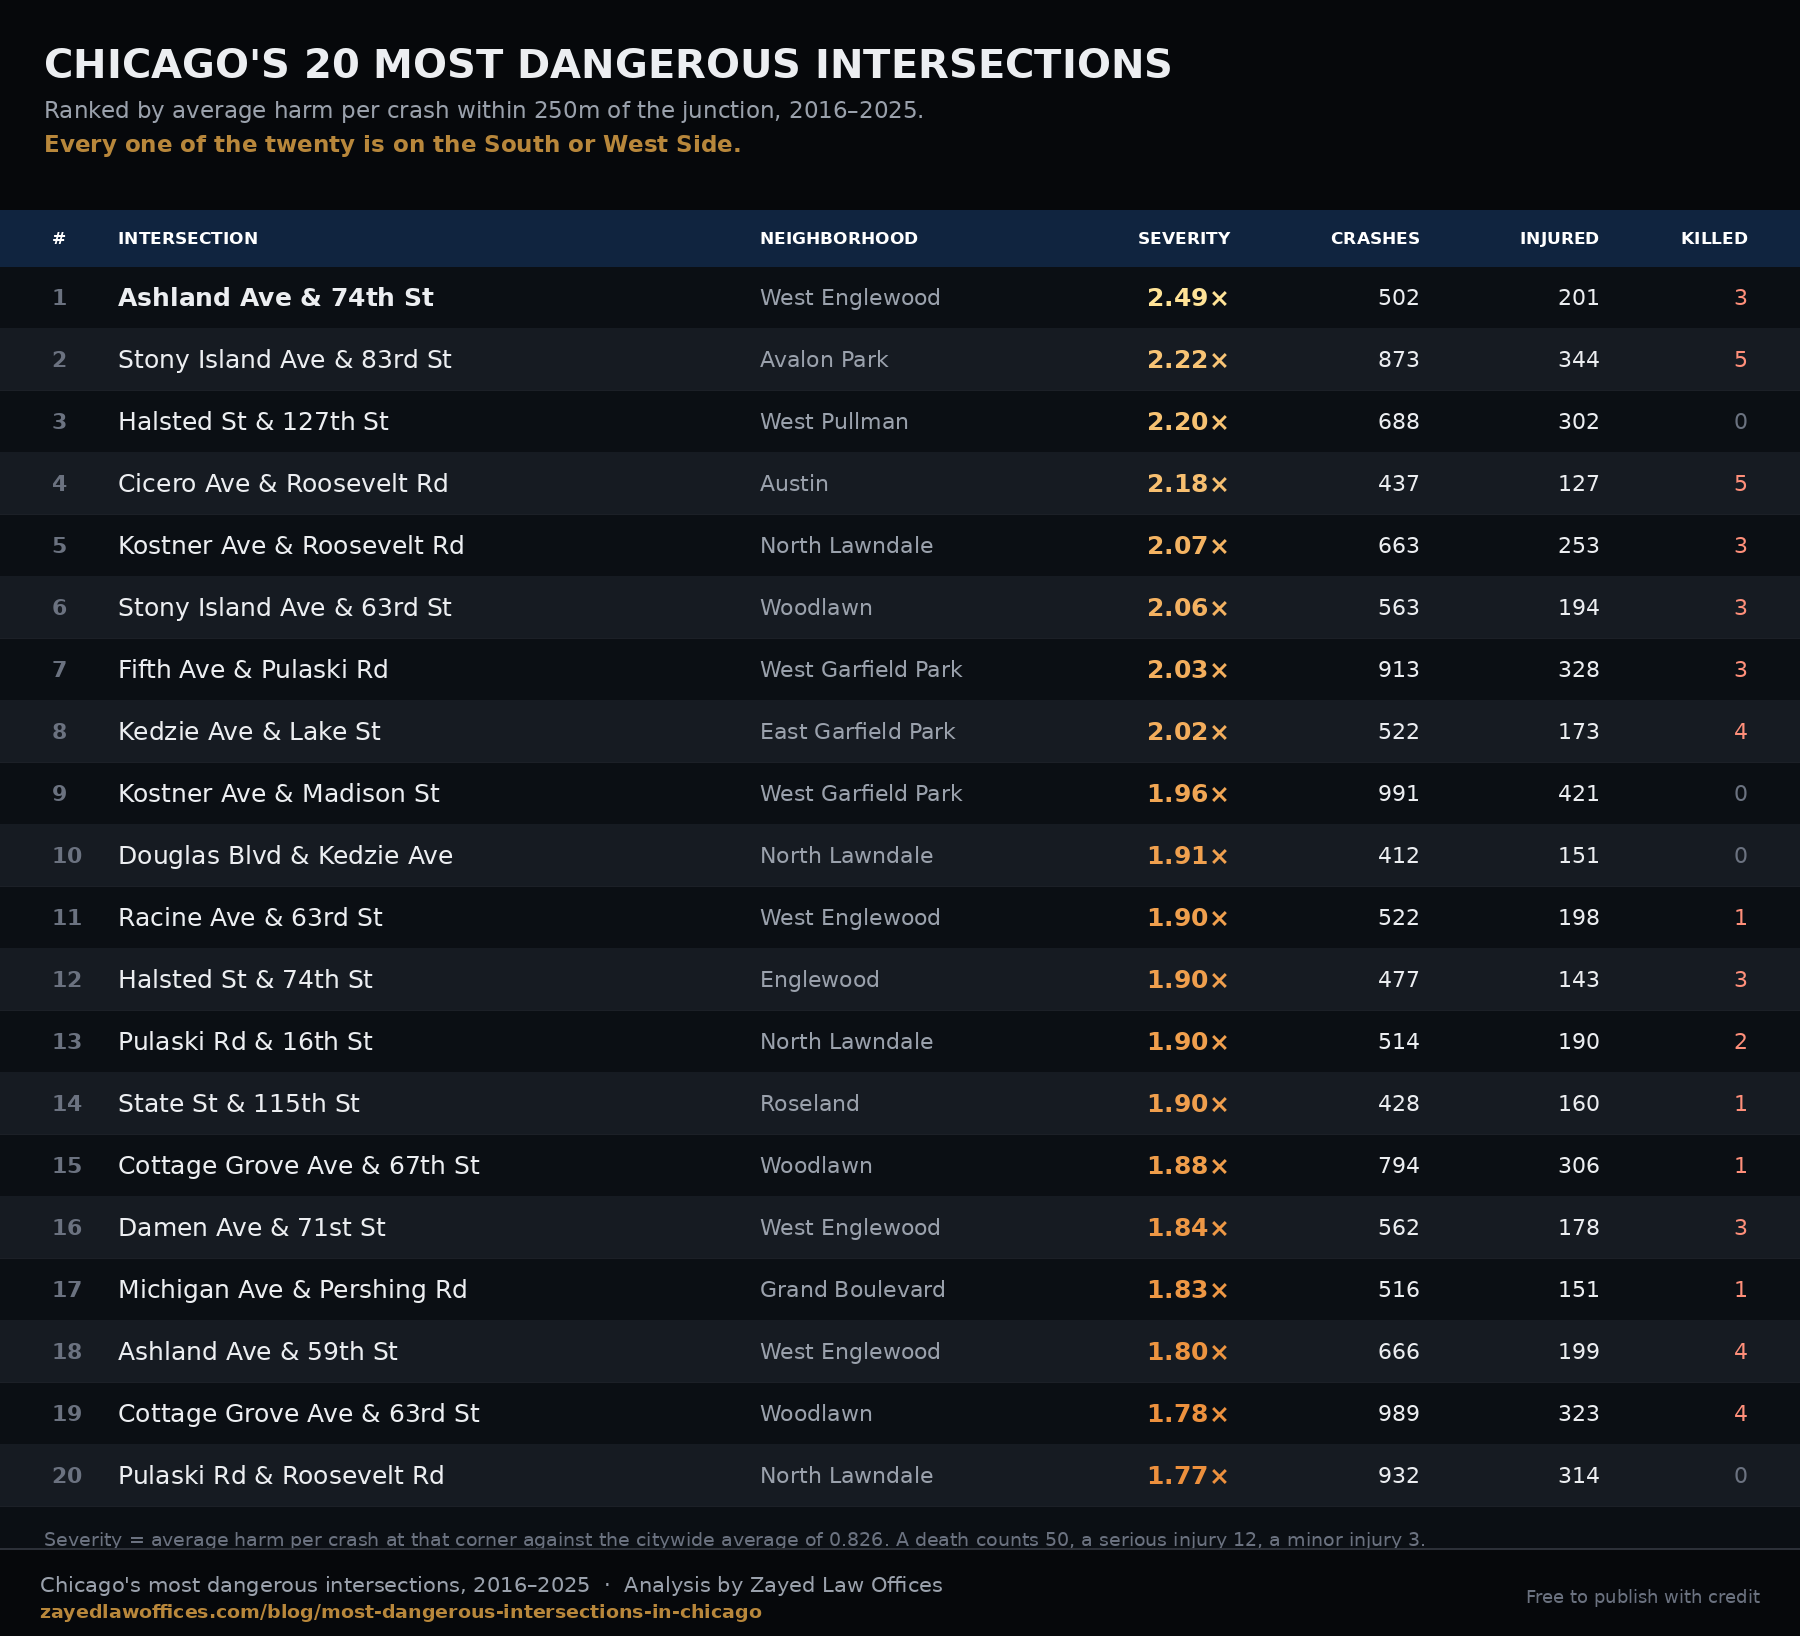
The full top 20
Ranked by average harm per crash within 250 metres of the junction, 2016–2025. Only junctions with at least 400 crashes in that period qualify.
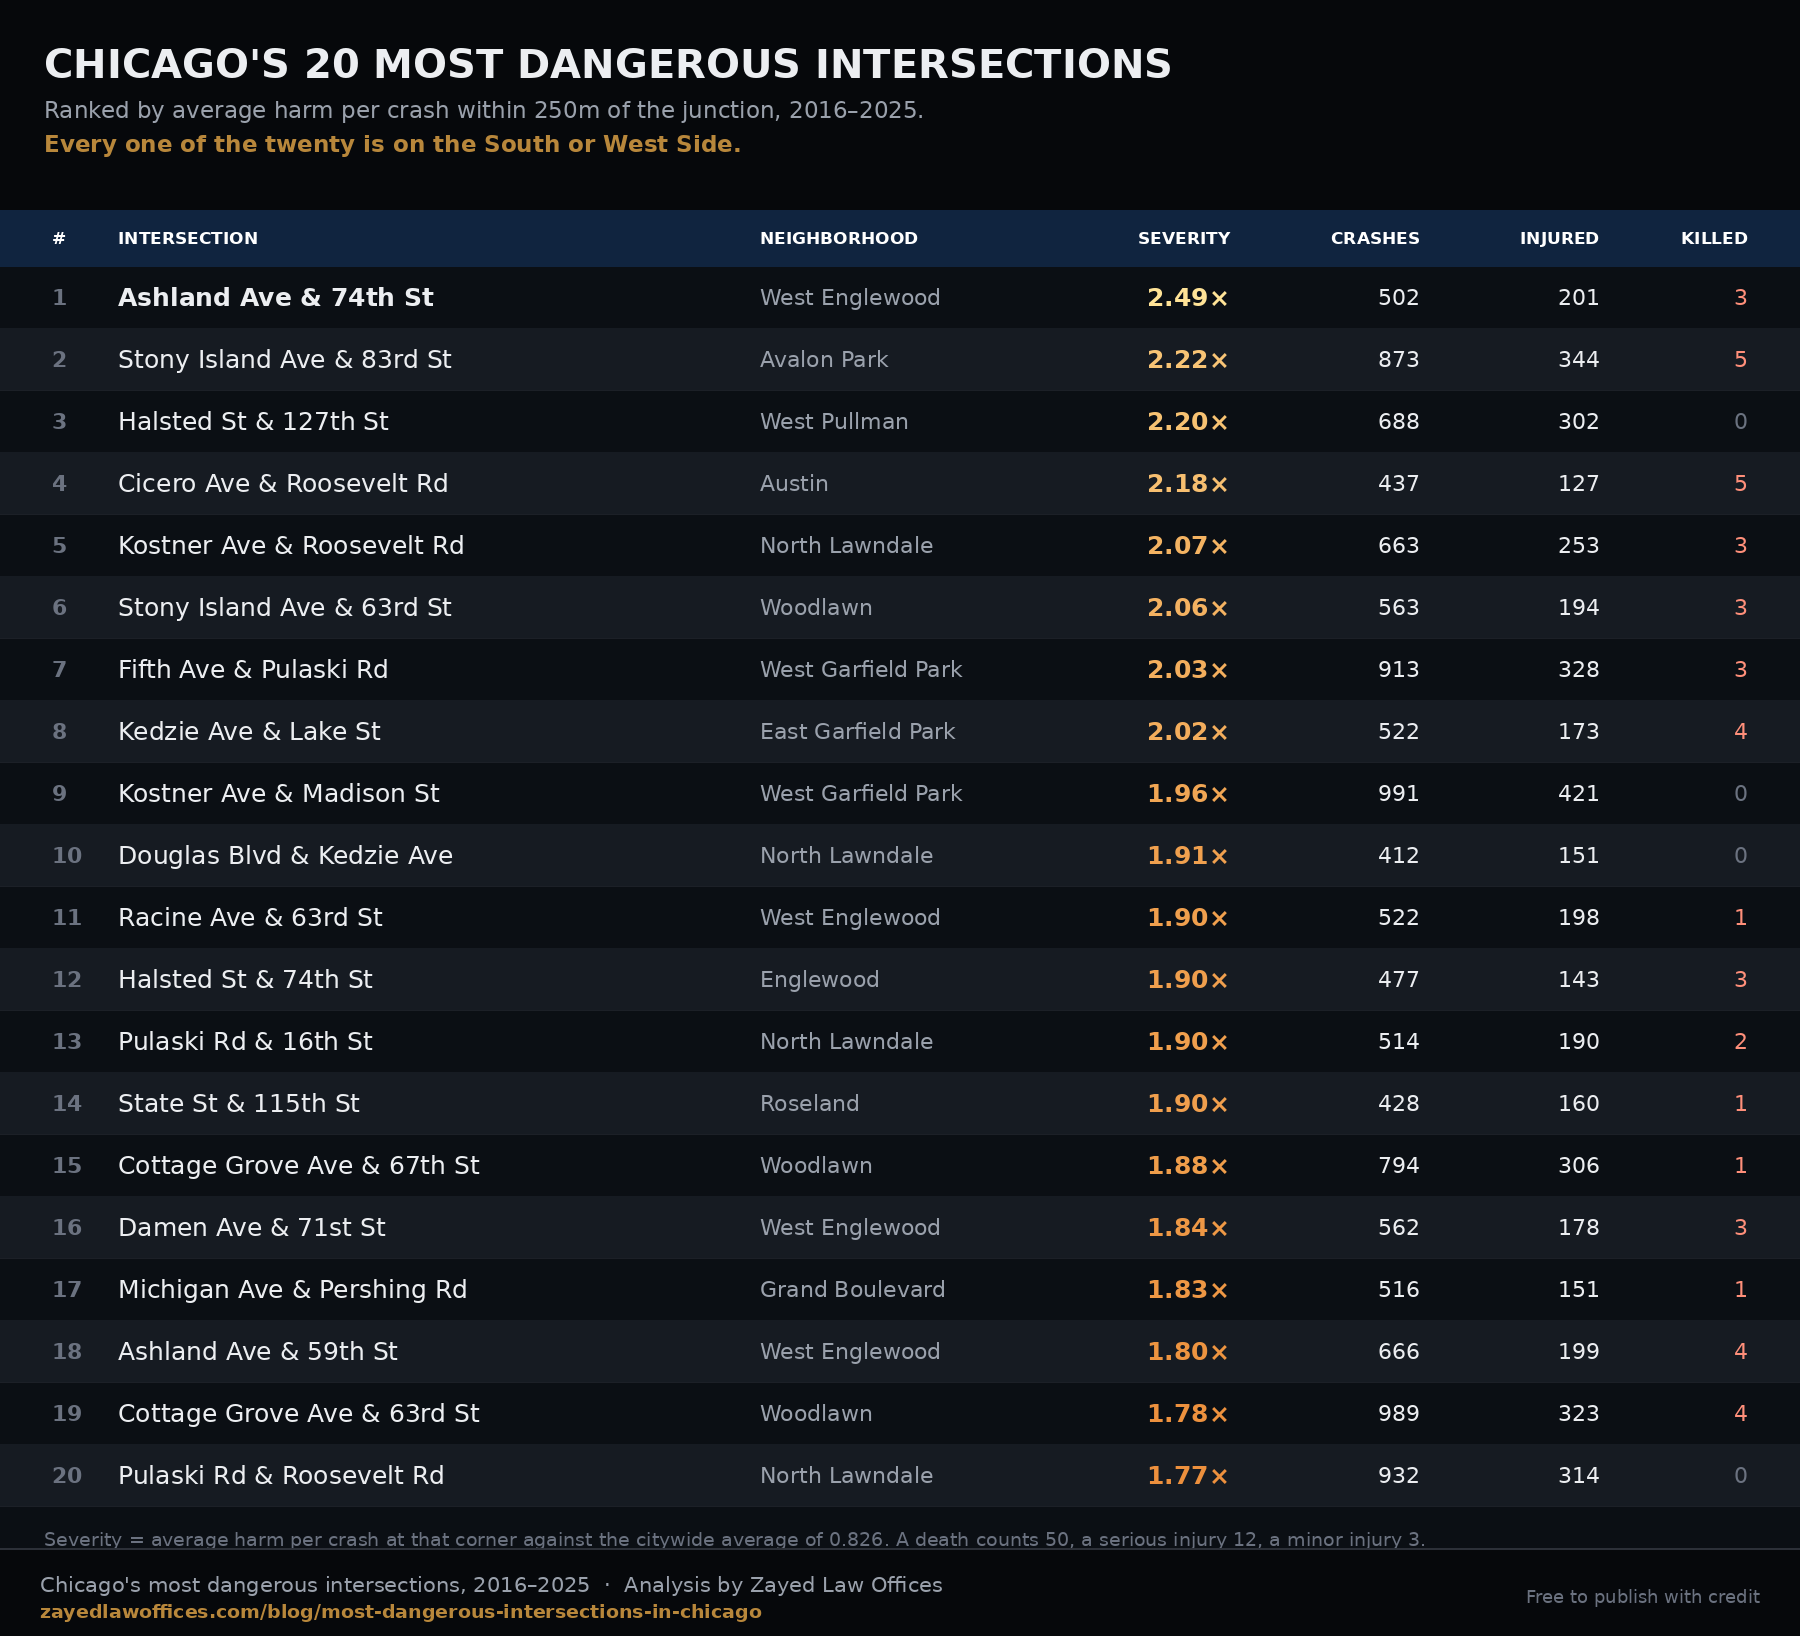
“Severity vs city” compares the average harm of a crash at that corner against the citywide average of 0.83. A figure of 2.00× means a crash there does twice the human damage of a typical Chicago crash. “Injured” counts all reported injuries; “Killed” counts fatalities.
Every single one is on the South or West Side
Twelve of the twenty are on the South Side and eight are on the West Side. Not one is downtown. Not one is on the North Side. This was not a filter we applied — it is what the data returned when we ranked the whole city on severity.
Four community areas appear more than once: West Englewood (4), North Lawndale (4), Woodlawn (3), West Garfield Park (2). Kostner Ave & Madison St in West Garfield Park carries the heaviest raw toll on the list — 991 crashes and 421 people injured.
Chicago’s own Vision Zero programme reached the same geography by a different route. The city’s High Injury Network — the 8% of streets that account for around 70% of serious and fatal crashes — is concentrated on the West and South Sides, and Vision Zero Chicago has repeatedly documented that residents of those communities are killed and seriously injured in traffic at several times the rate of residents elsewhere in the city. Our ranking is an independent check on that finding, built from the raw collision records rather than from the city’s own network definition, and it lands in the same place.
Why we ranked severity instead of crash counts
The obvious way to find the most dangerous intersection is to count crashes and take the highest number. The problem is that this mostly measures traffic. The busiest corners in Chicago rack up the biggest totals because enormous numbers of vehicles pass through them, often slowly, in dense downtown grids where a collision means a dented bumper.
Here is the same city ranked purely by crash count — the ten intersections where the most collisions were reported. Six of the ten are downtown, on the Near North Side or on the North Side, and almost every one of them is below the citywide severity average:
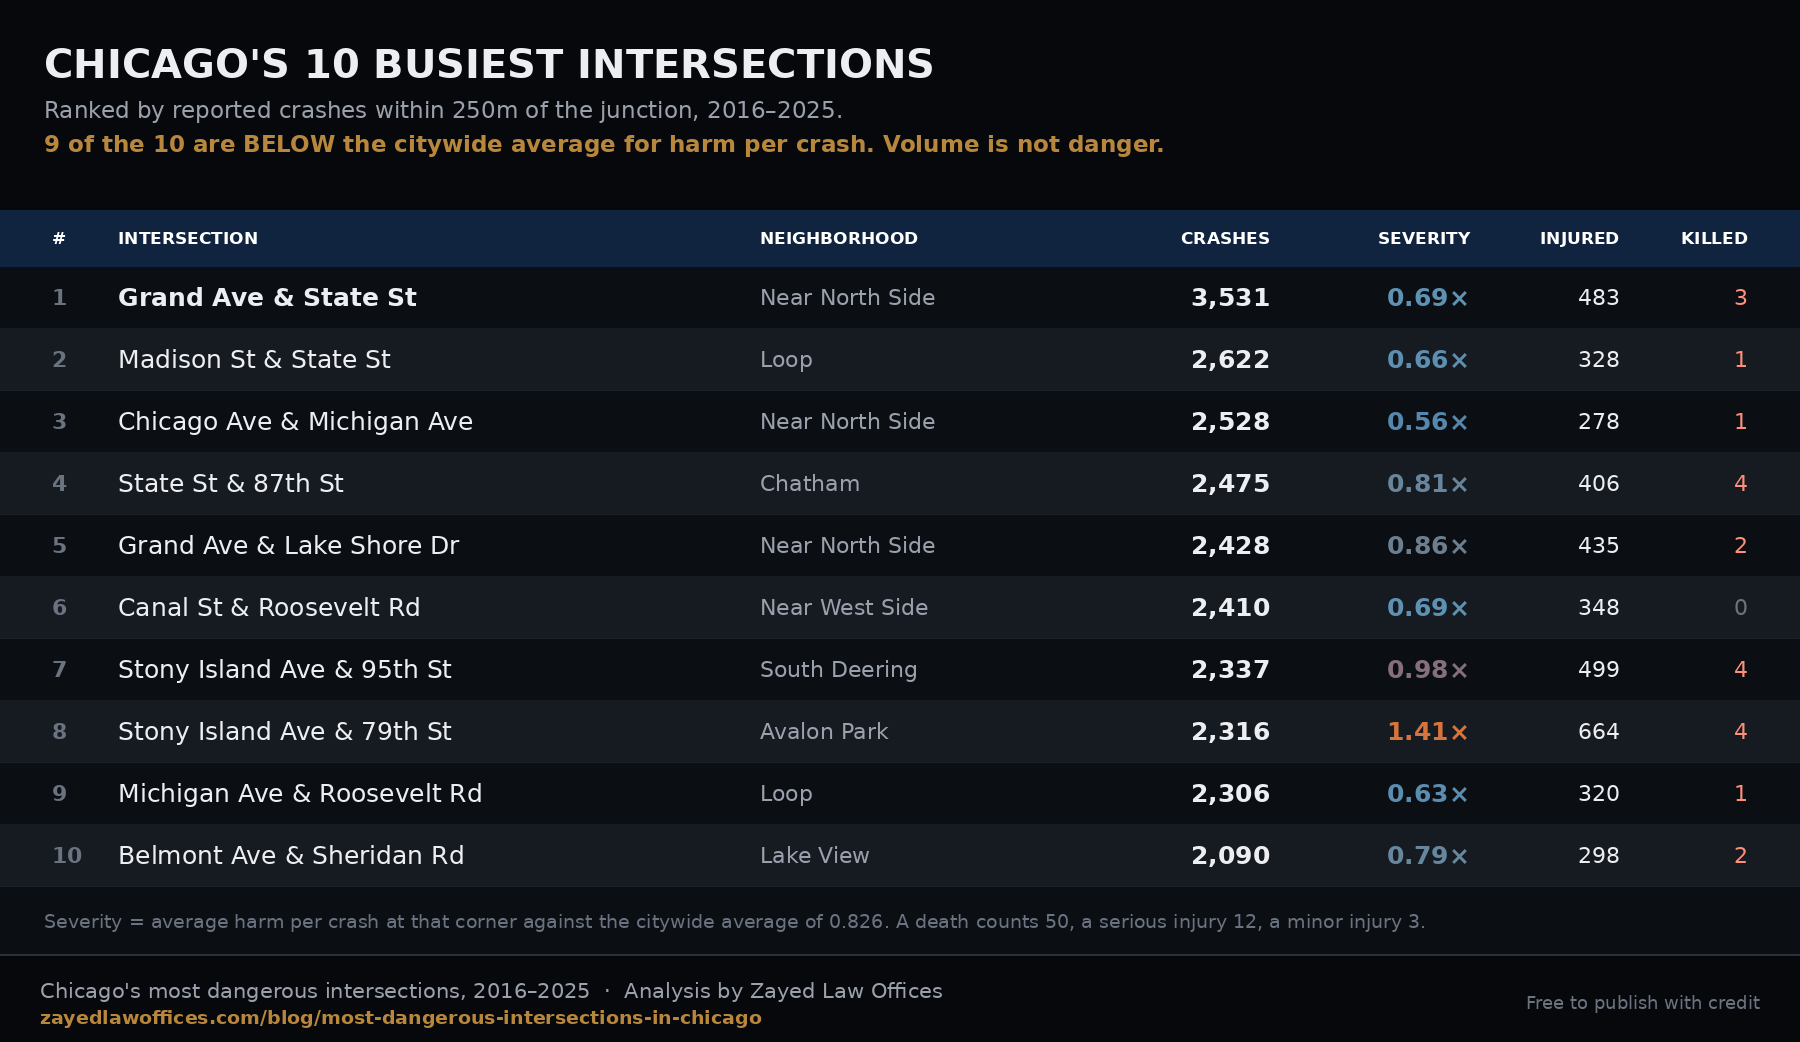
Corners marked in gold are below the citywide severity average — they produce large numbers of comparatively minor collisions. Nine of these ten busiest intersections are below average on severity, and not one of the twenty busiest appears anywhere in the severity top 20.
Grand Ave & State St is the clearest illustration. It logged 3,531 crashes in ten years — far more than any intersection in our severity top 20 — but its harm-per-crash figure is 0.69×, roughly 31% below the city average. It is the single busiest intersection in Chicago and one of the least harmful per collision. A crash-count ranking would have made it the most dangerous corner in the city — which would tell readers something true about congestion and something false about risk.
Both rankings are legitimate answers to different questions. That is why the map carries both, and why you can switch between them.
When Chicago’s roads are most dangerous
We ran the same severity measure across time rather than space. The pattern is consistent and, in places, counterintuitive.
Sunday is the most dangerous day — Friday the busiest
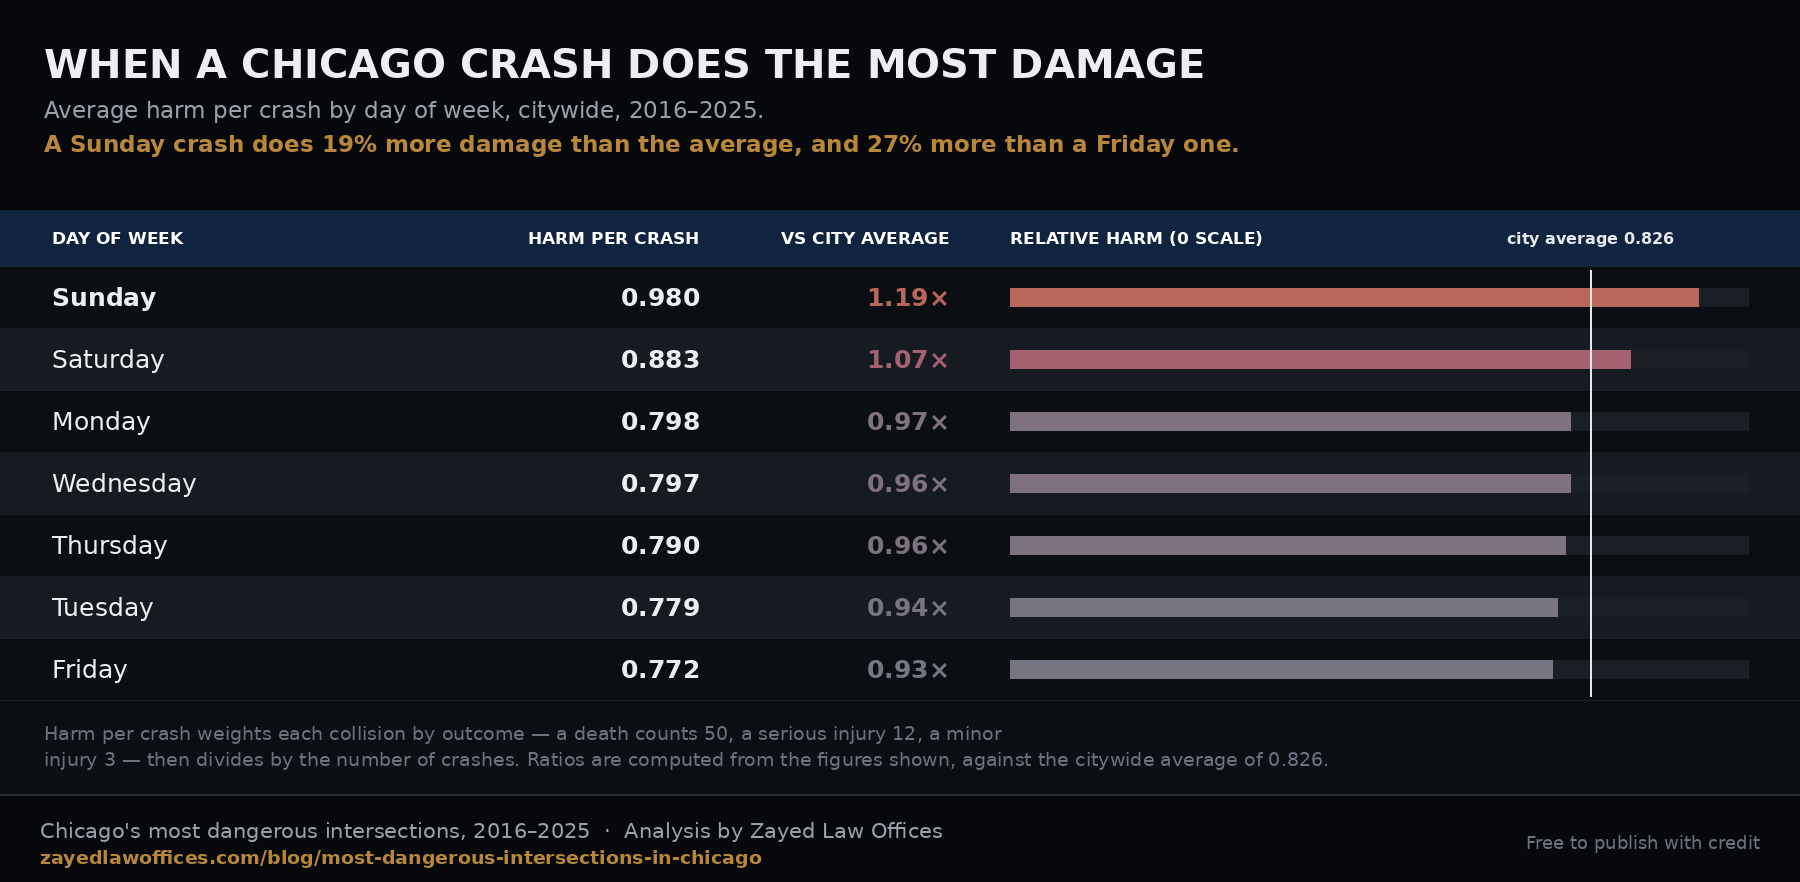
Friday produces more crashes than any other day (162,959 over the ten years) and the least harmful ones. Sunday produces fewer crashes but they are 19% more damaging than average, and a Sunday crash is 64% more likely to be fatal than the citywide rate.
2am is the deadliest hour — 3pm the busiest
Crashes at 2am do 1.67 times the average harm. The hours either side are barely better: 3am runs at 1.61×, 1am at 1.56×, 4am at 1.51×. Meanwhile 3pm is the single busiest hour on Chicago’s roads with 78,035 crashes, at 0.85× severity. Rush hour generates the most collisions and the least serious ones.
The worst single window of the week is Sunday between 4am and 5am, at 1.96× the citywide harm rate — very nearly double. Sunday 1am through 5am occupies four of the six worst day-and-hour blocks in the entire week.
Weekend nights versus weekday daytime
Between 10pm and 5am on Saturday and Sunday, Chicago recorded 63,625 crashes and 232 deaths — a harm rate of 1.54× the city average. Across Monday to Friday, 6am to 7pm, there were 568,381 crashes and 304 deaths, at 0.86×. Per crash, a weekend night collision is 6.8 times more likely to kill someone than a weekday daytime one.
July is the most dangerous month — February the safest
July crashes run 12% above the citywide harm rate, with September and August just behind at 8%. February sits 17% below. October, not July, logs the most collisions (92,939) — another case of volume and severity pointing in different directions.
What this means if you drive these roads
- Treat arterial crossings as the risk, not the highway. None of the twenty worst corners is an expressway junction. They are surface arterials meeting cross streets in residential neighbourhoods, where speed and pedestrian activity overlap.
- The quiet hours are the dangerous ones. Empty roads invite speed, and the small hours combine that with impairment and lower seatbelt use. A 2am crash is not like a 5pm crash.
- Sunday is not a safe day. It carries less traffic than a weekday and more harm per collision — the tail of Saturday night runs well into Sunday morning.
- If you are hit at one of these intersections, the record matters. Corners on this list have documented ten-year collision histories. That history is public, and it can be relevant evidence about a known hazard.
How we measured this
Every figure in this study comes from the City of Chicago’s public traffic crash records for 2016 through 2025 — 1,006,001 reported collisions with usable locations, in which 1,164 people were killed, 19,454 were seriously injured and 200,106 were injured in total.
The danger score
Counting crashes measures traffic. To measure danger, each crash is weighted by its worst outcome: a fatality counts 50, an incapacitating injury 12, and any other reported injury 3. Adding those up gives a harm total. Dividing harm by the number of crashes gives harm per crash — the average damage a collision at that location does. The citywide figure for 2016–2025 is 0.826. Every ratio in this study is a location’s harm per crash divided by that citywide figure.
What counts as an intersection
Junctions come from the City of Chicago Street Center Lines file, which records where named streets physically meet. A junction qualifies for this study when two differently named streets meet there and at least one of them is a classified arterial. That keeps the ranking on the corners Chicagoans can name and drive, and keeps out park drives, alleys and side streets that merely absorb the crashes of a busy road beside them.
All crashes within 250 metres of the junction are attributed to it. Where two qualifying junctions sit within 600 metres of each other, only the higher-ranked one is listed, so a single dangerous stretch cannot fill several places on the table. Junctions with fewer than 400 crashes across the ten years are excluded entirely — without that floor, one tragedy at a quiet corner would top the list on a sample of one.
Of 763 named arterial junctions in the city, 599 cleared the 400-crash floor and were ranked.
Limitations
These are reported crashes with usable location data. Minor collisions go unreported at different rates in different neighbourhoods, which if anything makes the severity ratios on the South and West Side conservative rather than inflated. Injury severity is as recorded by the reporting officer at the scene. The 250-metre radius means figures describe the immediate area around a junction rather than the junction box alone.
If you have been hurt at one of these intersections
Zayed Law Offices represents people injured in traffic collisions across Chicago. If you or someone in your family has been hurt at one of the intersections in this study, we can help you understand what your case involves and what the collision history at that location means for it. Consultations are free and there is no fee unless we recover for you.
Sources and data
City of Chicago Traffic Crashes — Crashes (data.cityofchicago.org, dataset 85ca-t3if), 2016–2025. Chicago Street Center Lines (dataset pr57-gg9e) for junction geometry and street classification. Chicago Department of Transportation, Vision Zero Chicago and the High Injury Network. Analysis and interactive map produced for Zayed Law Offices.